










1 / 10 Questions
0 Points
Points won
0
Correct score
0%

More Questions

More Articles

Did You Know? 10 Facts About U.S. Participation in Peacekeeping

Did You Know? 10 Facts About U.S. Participation in Peacekeeping

⏱️ 5 min read

Did You Know? 10 Facts About U.S. Participation in Peacekeeping

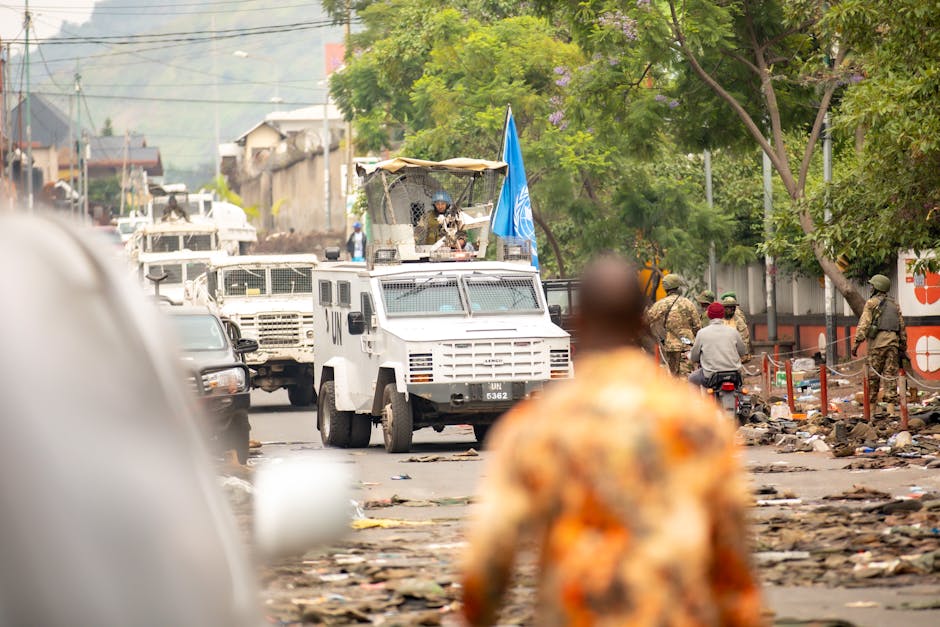
The United States has played a complex and often misunderstood role in international peacekeeping operations since the establishment of the United Nations in 1945. While the U.S. is frequently associated with unilateral military action, its contributions to multilateral peacekeeping missions have been substantial, multifaceted, and evolving. Understanding America's involvement in peacekeeping provides crucial insight into both U.S. foreign policy and the broader architecture of international security. Here are ten essential facts about U.S. participation in peacekeeping that illuminate this important dimension of global affairs.

1. The United States is the Largest Financial Contributor to UN Peacekeeping

Despite deploying relatively few troops to UN peacekeeping missions, the United States remains the largest financial contributor to UN peacekeeping operations. The U.S. is assessed approximately 27% of the total peacekeeping budget, which amounts to billions of dollars annually. This financial commitment reflects both America's economic capacity and its permanent seat on the UN Security Council, where peacekeeping mandates are authorized. The substantial funding helps support over 70,000 peacekeepers deployed worldwide in more than a dozen active missions.

2. American Troop Contributions Have Significantly Declined Since the 1990s

While the U.S. once deployed thousands of troops to UN peacekeeping missions, particularly during operations in Somalia and the Balkans in the 1990s, current troop contributions are minimal. As of recent years, the United States typically has fewer than 50 military personnel serving in UN peacekeeping missions globally. This dramatic reduction stems largely from policy shifts following controversial operations in Somalia and concerns about placing U.S. forces under UN command structures.

3. The U.S. Prefers Coalition Operations Outside the UN Framework

Rather than participating directly in UN-led peacekeeping missions, the United States often engages in stability operations through NATO, coalition forces, or bilateral arrangements. Operations in Kosovo, Afghanistan, and Iraq exemplify this preference for maintaining greater operational control and command authority. These missions, while sometimes serving similar peacekeeping functions, operate under different legal frameworks and command structures than traditional UN peacekeeping operations.

4. Presidential Decision Directive 25 Fundamentally Changed U.S. Peacekeeping Policy

Issued by President Bill Clinton in 1994 following the tragic events in Somalia, Presidential Decision Directive 25 (PDD-25) established stringent criteria for U.S. participation in peacekeeping operations. The directive required that missions serve U.S. national interests, have clear objectives, appropriate resources, and realistic exit strategies. This policy framework continues to influence American peacekeeping decisions decades later, emphasizing selectivity and national interest calculations.

5. The U.S. Provides Critical Logistical and Intelligence Support

Although troop contributions are limited, the United States provides invaluable logistical support, transportation, intelligence sharing, and training to UN peacekeeping operations. American military airlift capabilities, satellite intelligence, and specialized equipment significantly enhance mission effectiveness. This support often proves more valuable than additional boots on the ground, enabling peacekeepers from other nations to operate more effectively in challenging environments.

6. America Leads Global Peacekeeping Training Initiatives

The United States has established numerous programs to train peacekeepers from other nations, particularly African countries that contribute the majority of UN peacekeeping personnel. Through initiatives like the Global Peace Operations Initiative (GPOI) and its predecessors, the U.S. has trained and equipped hundreds of thousands of peacekeepers worldwide. These capacity-building efforts represent a significant American contribution to international peacekeeping infrastructure.

7. The First UN Peacekeeping Mission Had Strong U.S. Support

The United Nations Truce Supervision Organization (UNTSO), established in 1948 to monitor the Arab-Israeli truce, marked the beginning of UN peacekeeping. The United States played a crucial role in supporting this mission's creation and has maintained consistent backing for peacekeeping as a tool for managing international conflicts. This early support established precedents for U.S. engagement with multilateral peace operations.

8. Congressional Skepticism Shapes U.S. Peacekeeping Policy

The U.S. Congress has historically exhibited skepticism toward UN peacekeeping, periodically withholding assessed contributions and imposing caps on the percentage of peacekeeping budgets America will fund. Legislative restrictions have sometimes limited presidential flexibility in supporting peacekeeping operations. This tension between executive branch foreign policy goals and congressional budget authority creates ongoing challenges for consistent U.S. peacekeeping engagement.

9. U.S. Military Personnel Serve in Key Leadership Positions

While overall troop numbers are low, American military officers frequently serve in senior leadership, planning, and advisory roles within UN peacekeeping operations and the UN Department of Peace Operations. These positions allow the U.S. to maintain influence over peacekeeping strategy and operations while limiting direct troop commitments. American expertise in logistics, planning, and military operations proves valuable in these leadership capacities.

10. The U.S. Champions Peacekeeping Reform and Accountability

The United States has been a leading voice calling for peacekeeping reform, advocating for improved mission planning, better protection of civilians, enhanced accountability for misconduct, and more efficient resource utilization. American pressure has contributed to significant reforms in areas such as preventing sexual exploitation and abuse by peacekeepers, improving performance evaluation systems, and establishing clearer mandates for missions. These reform efforts aim to make peacekeeping more effective and credible.

Conclusion

U.S. participation in international peacekeeping represents a nuanced approach that balances support for multilateral conflict management with concerns about sovereignty, command authority, and national interests. While troop contributions remain minimal, American financial support, logistical capabilities, training programs, and diplomatic engagement make the United States an indispensable partner in the global peacekeeping enterprise. Understanding these ten facts provides essential context for evaluating both the strengths and limitations of U.S. peacekeeping policy. As global conflicts evolve and new challenges emerge, America's role in peacekeeping will continue adapting, requiring ongoing dialogue about how best to contribute to international peace and security while protecting national interests and values.
Top 10 Ways Interactive Graphics Explain Complex Stories

Top 10 Ways Interactive Graphics Explain Complex Stories

⏱️ 6 min read

Top 10 Ways Interactive Graphics Explain Complex Stories

In an era of information overload, journalists and content creators face the ongoing challenge of making complex stories accessible and engaging for diverse audiences. Interactive graphics have emerged as powerful tools that transform dense data, intricate processes, and multifaceted narratives into digestible, compelling visual experiences. These dynamic visual elements do more than simply illustrate stories—they invite audiences to explore, discover, and understand information at their own pace. Here are the top ten ways interactive graphics revolutionize how we explain complex stories in modern journalism and digital media.

1. Simplifying Data Through Visual Hierarchy

Interactive graphics excel at organizing vast amounts of data into comprehensible visual hierarchies. By allowing users to drill down from broad overviews to specific details, these tools prevent information overload while maintaining depth. For instance, economic data covering multiple countries and decades can be presented initially as a simple chart, with interactive elements enabling users to explore specific regions, time periods, or economic indicators according to their interests. This layered approach respects both the casual reader seeking quick insights and the dedicated researcher demanding comprehensive data.

2. Enabling User-Controlled Exploration

Unlike static infographics, interactive graphics empower readers to become active participants in their learning journey. Users can choose which aspects of a story to explore first, how deeply to investigate particular elements, and at what pace to consume information. This self-directed exploration increases engagement and retention, as individuals naturally focus on aspects most relevant to their understanding and interests. Whether examining political election results by county or understanding climate change projections for specific regions, user control transforms passive reading into active discovery.

3. Demonstrating Cause and Effect Relationships

Complex stories often involve intricate cause-and-effect chains that are difficult to convey through text alone. Interactive graphics can illustrate these relationships dynamically, showing how changing one variable affects others in real-time. Financial models, environmental systems, and public health scenarios become tangible when users can manipulate inputs and immediately observe outcomes. This hands-on approach to understanding causality makes abstract concepts concrete and helps audiences grasp the interconnected nature of complex systems.

4. Providing Temporal Context and Evolution

Many important stories unfold over time, and interactive graphics offer unparalleled tools for showing temporal progression. Animated timelines, scrollable sequences, and time-slider controls allow audiences to witness how situations evolved, compare different time periods, and identify patterns and trends. Whether tracking the spread of a pandemic, the development of urban areas over decades, or the changing political landscape across election cycles, these temporal visualizations make history and progression tangible and memorable.

5. Facilitating Geographic Understanding

Interactive maps have become indispensable for stories with spatial dimensions, from local community issues to global conflicts. These geographic visualizations allow users to zoom, pan, and click through different locations, revealing location-specific data and narratives. Heat maps can show density and distribution patterns, while layered maps can compare different metrics across the same geography. This spatial storytelling helps audiences understand not just what happened, but where it happened and why location matters.

6. Personalizing Information and Relevance

Interactive graphics can tailor information to individual users based on their inputs, making abstract statistics personally meaningful. Tools that allow users to enter their age, location, income, or other demographic information can show how broader trends specifically affect them. A story about retirement savings becomes more impactful when readers can input their current savings and see personalized projections. This personalization bridges the gap between large-scale data and individual circumstances, making complex policy discussions and statistical analyses feel immediately relevant.

7. Breaking Down Complex Processes Step-by-Step

Certain stories require explaining complicated processes, from how legislation becomes law to how vaccines work at a cellular level. Interactive graphics can break these processes into manageable steps that users navigate sequentially or explore non-linearly. Each stage can include detailed explanations, supporting data, and contextual information without overwhelming the reader. This modular approach to process explanation accommodates different learning styles and allows users to spend more time on concepts they find challenging while moving quickly through familiar material.

8. Comparing Multiple Scenarios and Outcomes

Interactive graphics excel at presenting side-by-side comparisons and alternative scenarios. Users can toggle between different options, adjust parameters to create "what-if" situations, and directly compare outcomes. This capability proves invaluable for stories involving policy choices, budget allocations, or strategic decisions where multiple paths exist. By visualizing different scenarios simultaneously or sequentially, these graphics help audiences understand trade-offs, evaluate options, and appreciate the complexity of decision-making processes.

9. Revealing Hidden Patterns in Big Data

When dealing with massive datasets, static presentations can only show predetermined insights. Interactive graphics, however, allow users to filter, sort, and visualize data in multiple ways, potentially revealing patterns that even journalists might not have initially highlighted. Searchable databases, customizable scatter plots, and dynamic filtering systems transform raw data into explorable resources. This transparency not only enhances understanding but also builds trust by allowing audiences to verify conclusions and conduct their own investigations.

10. Integrating Multiple Media and Narrative Layers

Modern interactive graphics serve as frameworks that integrate various media types—text, video, audio, photographs, and data visualizations—into cohesive narrative experiences. Rather than consuming these elements separately, users encounter them as interconnected parts of a larger story. A graphic about a natural disaster might combine satellite imagery, survivor testimonies, meteorological data, and infrastructure maps into a single interactive experience. This multimedia integration creates richer, more comprehensive storytelling that engages multiple senses and learning modalities simultaneously.

Conclusion

Interactive graphics represent a fundamental evolution in how complex stories are communicated in the digital age. Through visual hierarchy, user control, dynamic demonstrations, temporal context, geographic understanding, personalization, process breakdown, scenario comparison, pattern revelation, and multimedia integration, these tools address the central challenge of modern journalism: making increasingly complex information accessible and engaging. As technology continues advancing and audiences become more digitally sophisticated, interactive graphics will play an ever-more critical role in bridging the gap between complexity and comprehension. For journalists, editors, and content creators, mastering these ten approaches to interactive storytelling is no longer optional—it is essential for effectively serving audiences who demand both depth and clarity in their news consumption. The future of explanatory journalism lies not in simplifying complex stories to the point of oversimplification, but in creating interactive experiences that respect complexity while making it navigable, understandable, and personally relevant.